BunnyCDN returns the server location and ID code with every request, which can help you easily determine which PoP and server you are being connected to. This guide explains how to get this information in three easy steps or by using automated diagnostic tools.
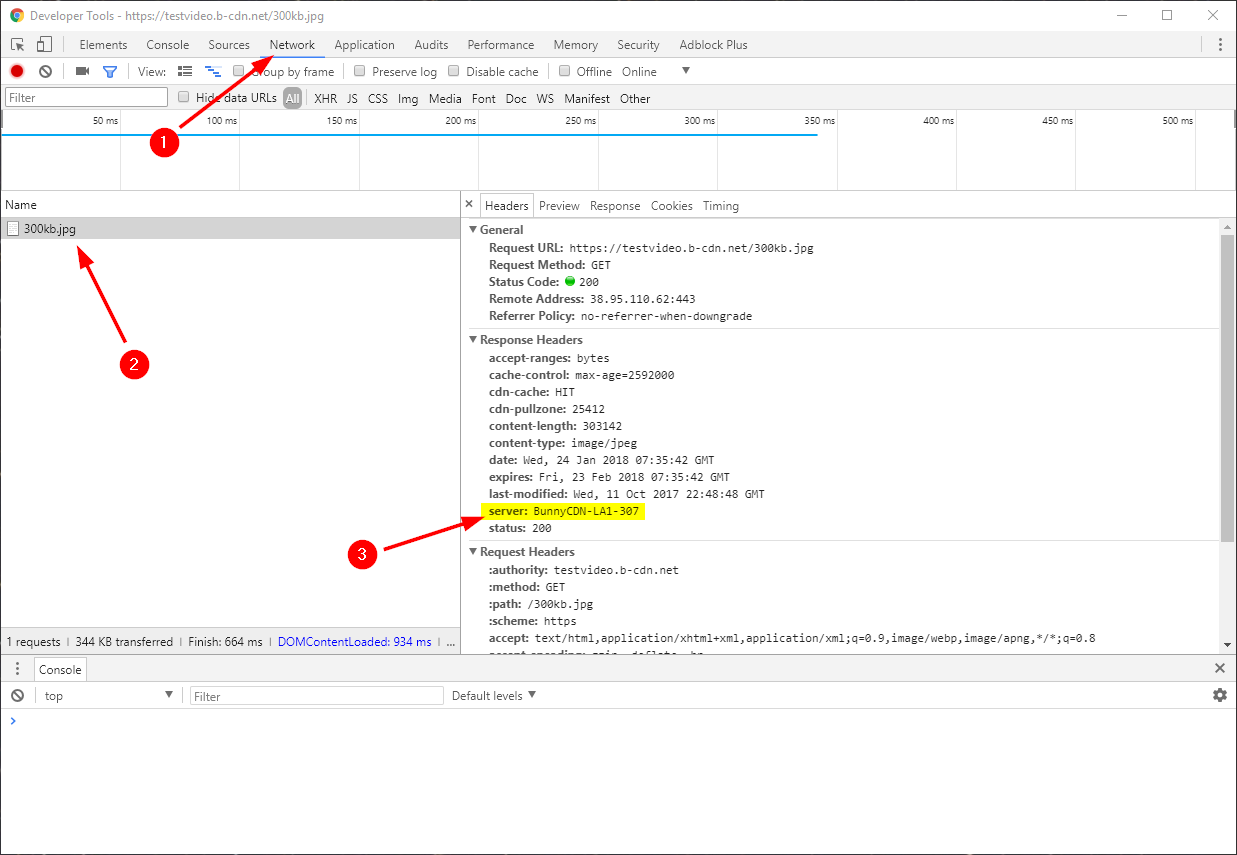
1. Open your browser debug console
First, open your web browser developer tools by pressing Ctrl + Shift + I (Windows/Linux) or Cmd + Option + I (Mac) on your keyboard, and switch to the Network tab in the newly opened window.
Note: In our example we are using Google Chrome, but the procedure is nearly identical across all modern web browsers.
2. Find a bunny.net request in the network list
Next, enter the hostname of your Pull Zone into your browser address bar (such as https://mytestzone.b-cdn.net) and navigate to it. After the page finishes loading, you will see a list of individual assets and network requests appear in the table.
Select one of the requests going directly to BunnyCDN—this is typically the very first HTML document or initial request in the list.
After selecting the request, a detail panel will open displaying the headers returned by the edge node you connected to. Look closely under the Response Headers section for the Server header, which will look something like BunnyCDN-{PoP Code}-{Server-ID}.
When debugging routing issues, you can use this to determine which location you are being routed to and if requested, forward this to our support team.
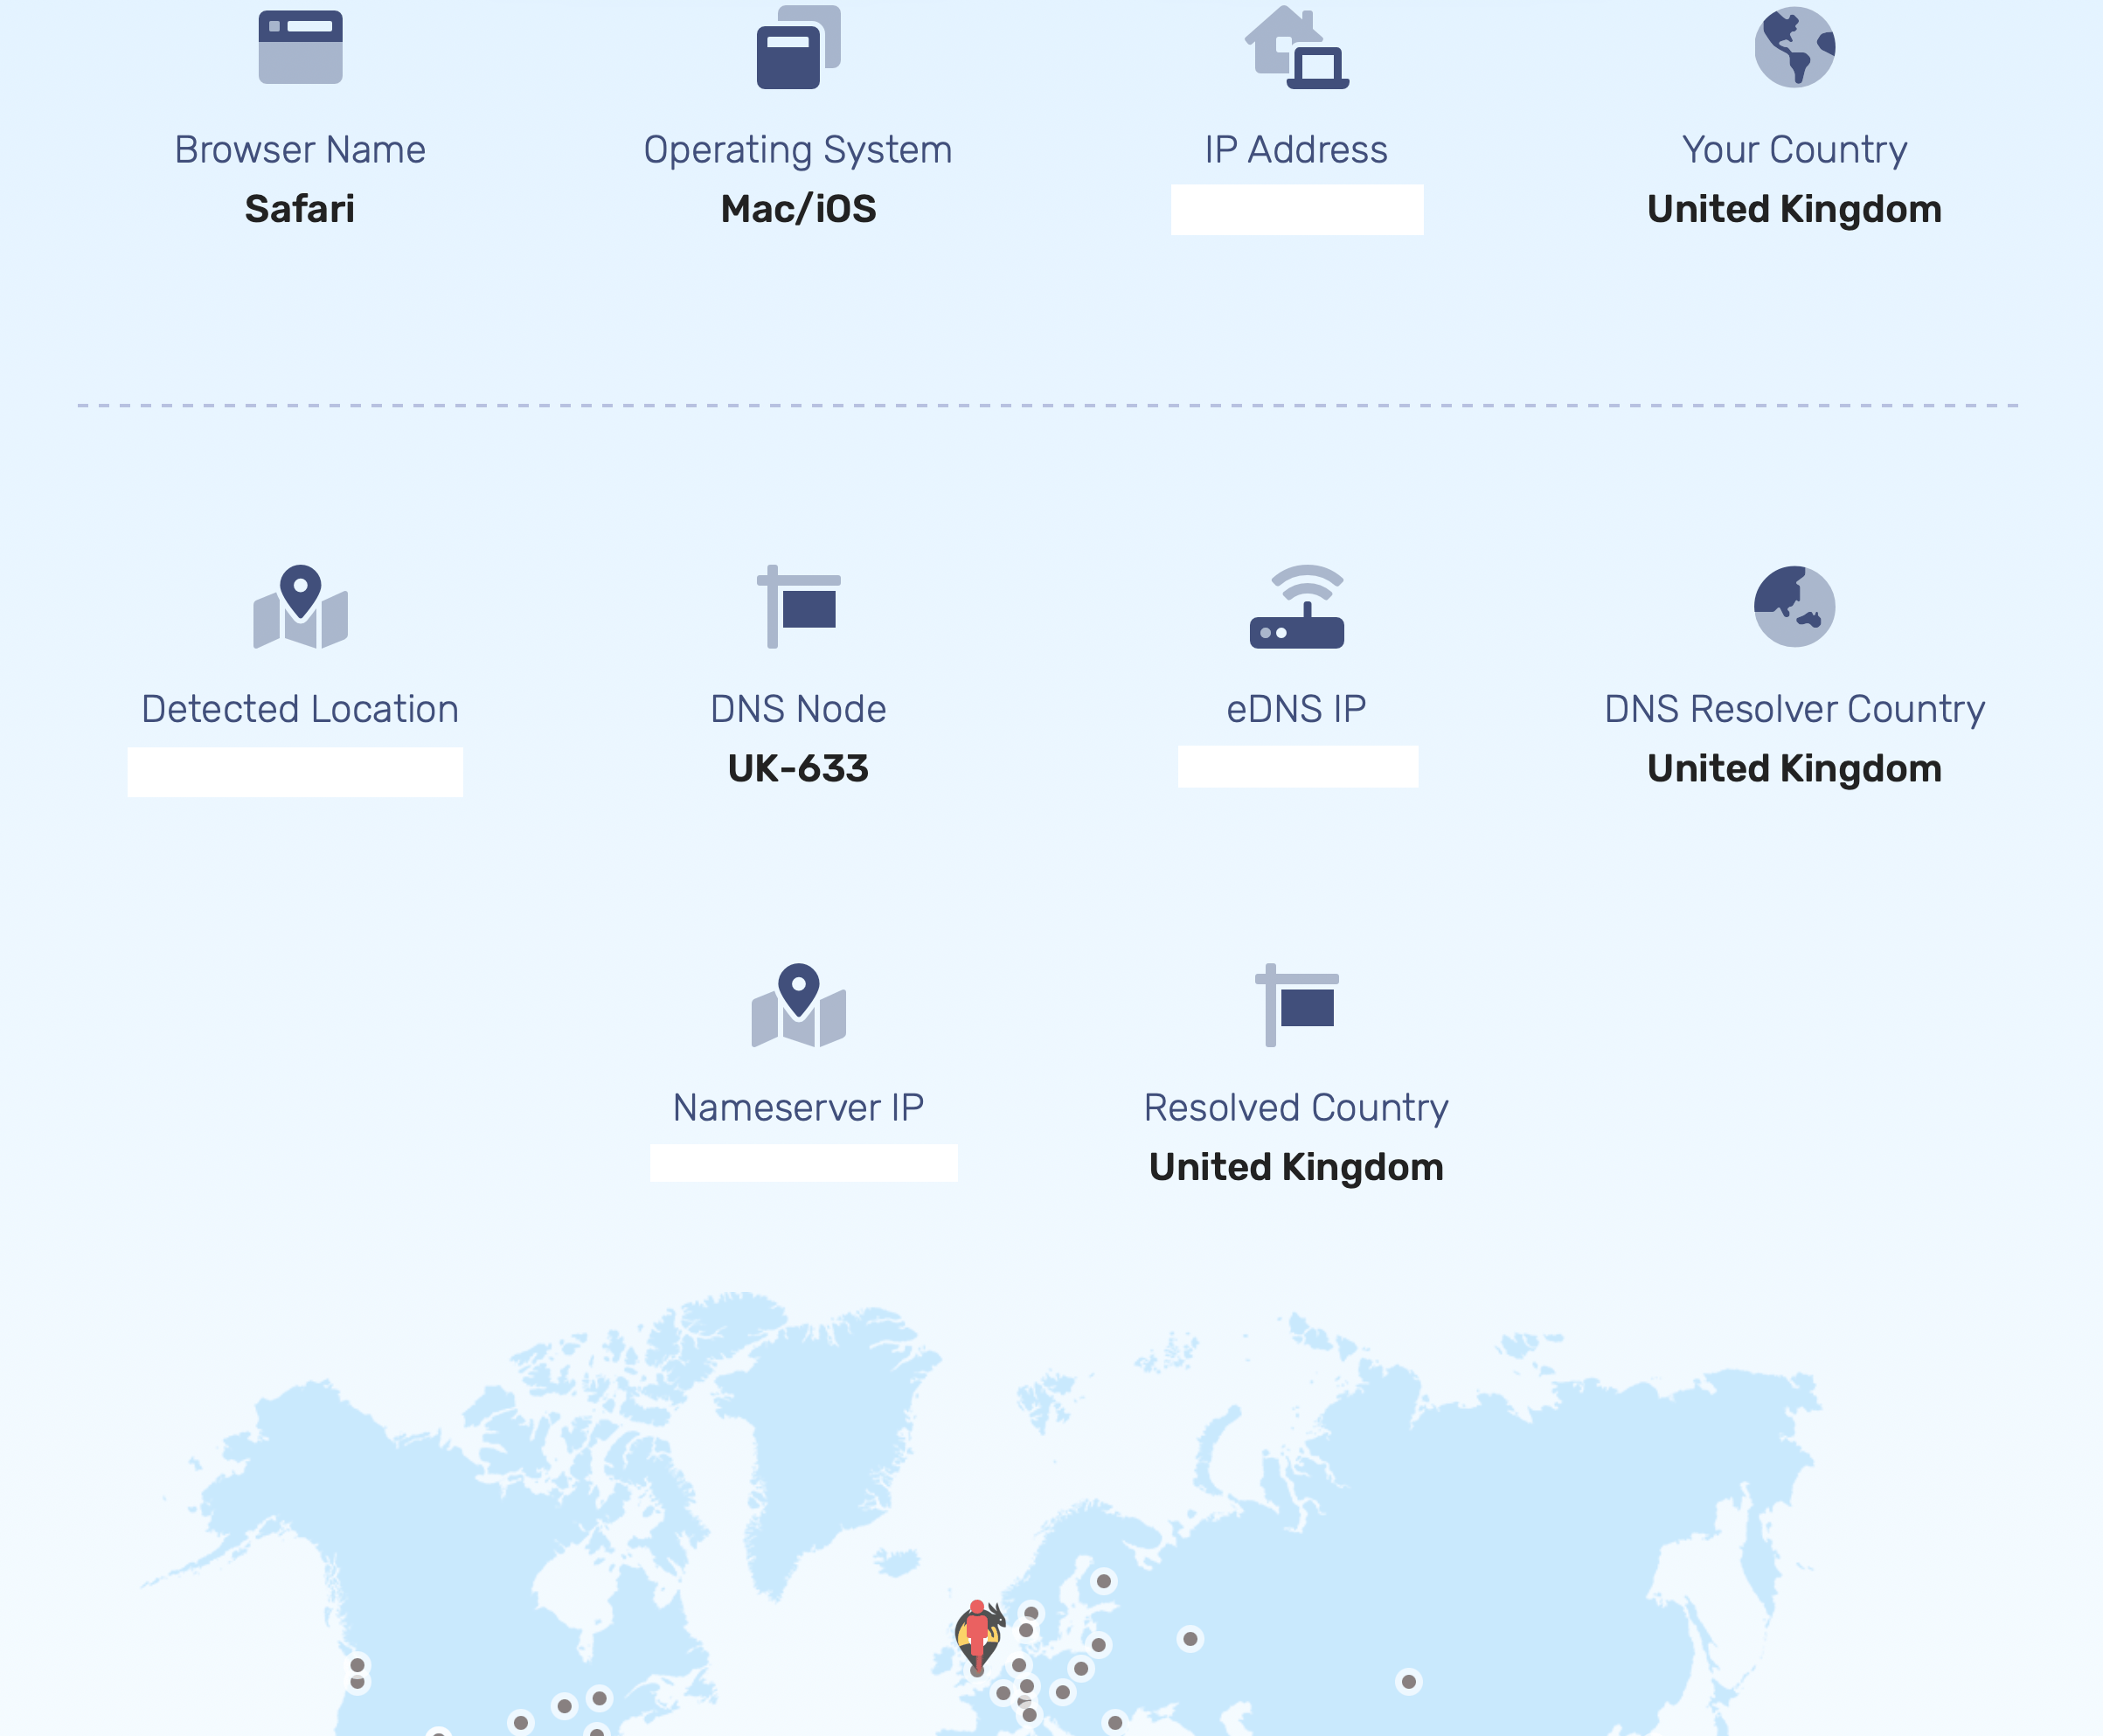
In addition to the above, you can use our new diagnostic tools here: Bunny Diagnostic Tools which will show you some metrics about your connection:
Last modified on July 3, 2026