


Get Better Streaming Insights With New Metrics and Video Heatmaps

Dejan Grofelnik Pelzel

December 21, 2021
At bunny.net, we believe detailed metrics are one of the most important aspects of each project. They allow us to spot issues, see what works, what doesn't work and optimize systems and workflows accordingly.
However, when we launched the initial version of Bunny Stream nine months ago with the vision of building a better way to deliver online video, we included only a very basic view count. During that time, our focus was to make sure we build a reliable and simple way for developers to handle their video workflow.
We're excited to say this changes today as we continue our series of updates for Bunny Stream this week.
We understand that data is everything and we want to be able to offer developers and content creators as much information as possible about how your content is viewed, how long and where your content is viewed for, or even which video sections are popular and what peaked the viewer interests.
To do that, we're excited to announce that over the past few weeks, we have added a series of new features to Bunny Stream to get more information about how your content is being consumed!
Watch Time Heatmaps
To gain more visibility into viewer behavior and also allow other users to find interesting parts of the videos, we're excited to introduce the new video Watch Time Heatmaps.
Watch time heatmaps are automatically generated for each video and record watch time metrics for each section of the timeline. Once sufficient data is generated, the system will automatically generate an unobtrusive chart above the timeline to help the viewer navigate through the video. You can see this in action in the video below.
New Video Statistics
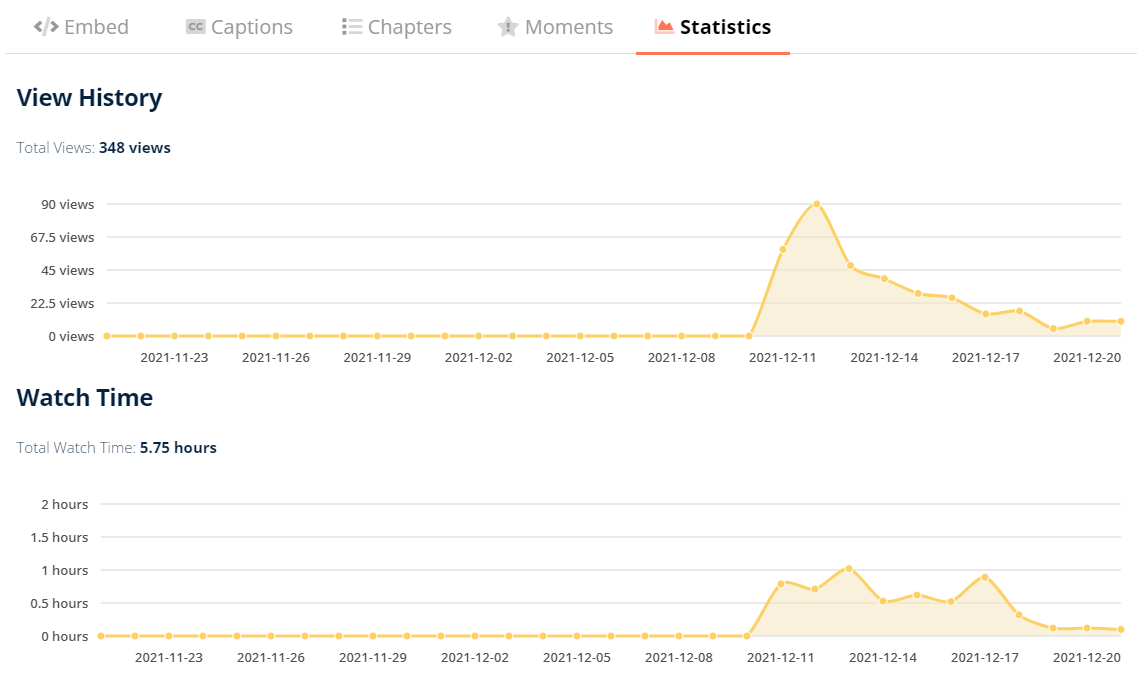
Bunny Stream now automatically tracks per video views and watch time history through time to give you an insight into the performance of each video as well the full library.
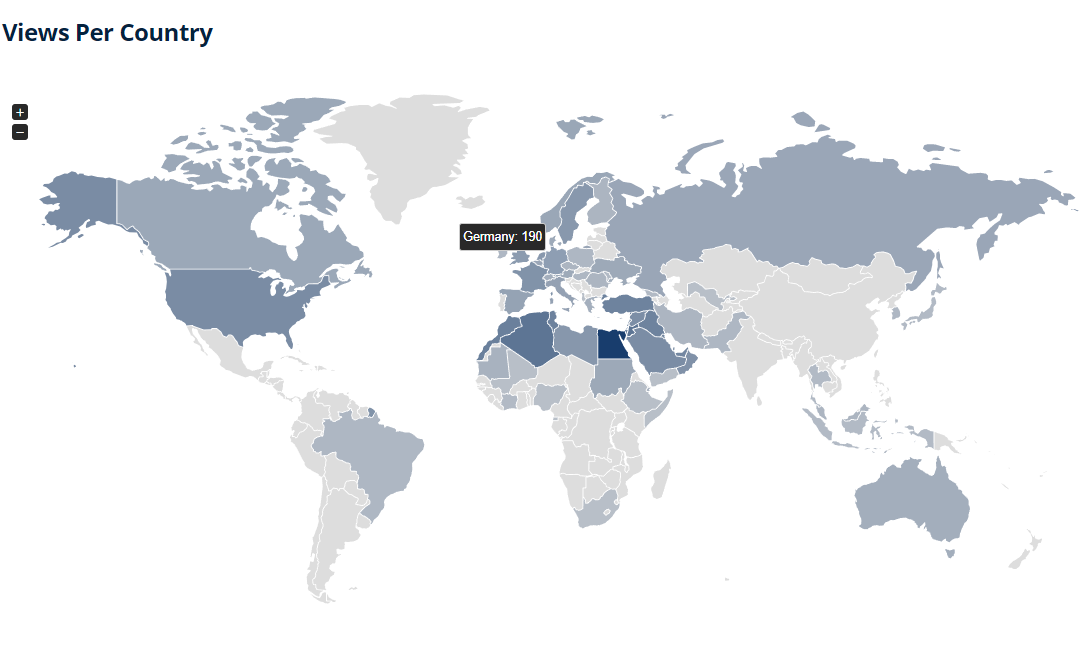
We have also added geographical view tracking and average watch time per country to be able to better understand how different audiences react to your content.
Additionally, we equipped each video with the total watch time metric, so if a video goes viral, you can see how many combined years your users spent watching it.
Engagement Score
Finally, we're introducing a new system called Engagement Score. The engagement score system automatically calculates one simple number to give you an overview of how engaging the video was to your viewers. This is based on a couple of different metrics, but primarily the amount of time an average user spent watching the video. The longer the time, the higher the score.
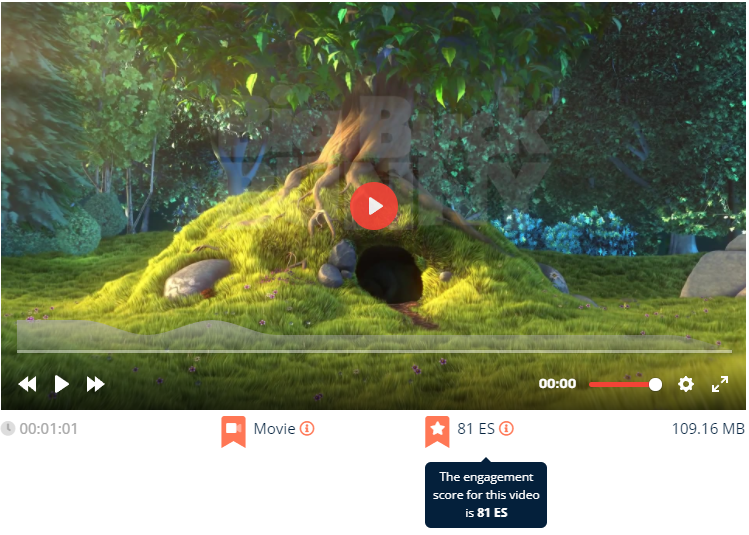
Engagement Score is the easiest way to see how a video is doing by using a simple number between 0 to 100 without worrying about various correlations between many different metrics.
Continuing our mission of building a better way of delivering online video!
Today, Bunny Stream powers almost 5 million videos and growing and we're excited to continue our mission of building a better way of delivering online video.
We have multiple exciting new announcements coming throughout the week, so say tuned as we continue pushing our mission of building a better way to deliver online video.
If there are any metrics that you would love to see and still aren't available, make sure to let us know and if you would like to help us continue building a better way of delivering video, make sure to check out our careers page!