No more 502 guesswork: all users can now monitor origin errors

Jamie Barton

Marek Nalikowski

October 29, 2025
Your site goes down and chaos follows. Users are furious, your boss wants answers, but your dashboard offers nothing.
Just a wall of 502s and not a hint as to why. DNS? Timeouts? Misconfigured origin? You’re left debugging in the dark as every second drains money and trust.
Today, we’re hopping past that problem by adding origin errors: real-time visibility into every connection failure, timeout, and misconfiguration, available now to everyone at no extra cost.
Finally, answers when things break
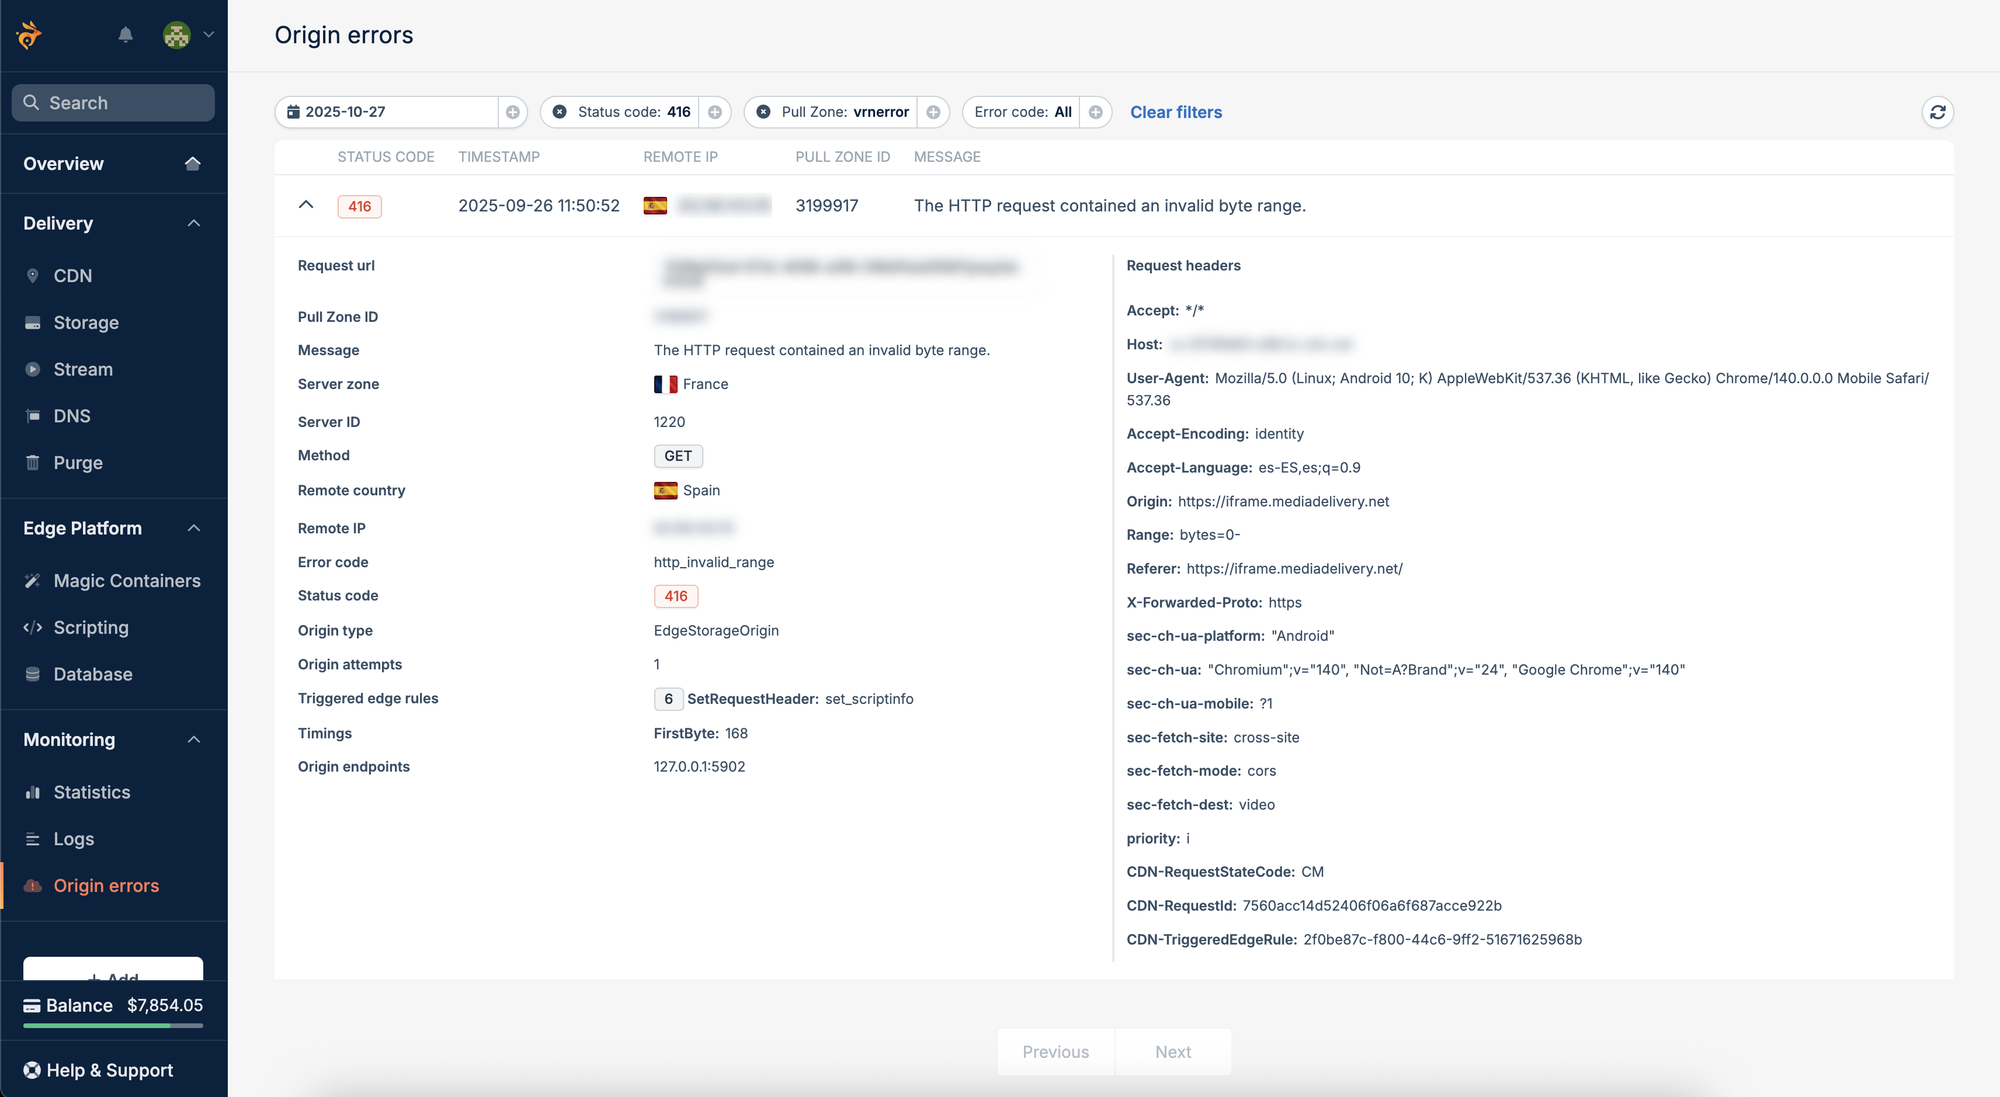
When connection errors happen (and they will), you need answers fast. bunny.net captures origin errors in real time. Instead of just staring at generic 502 messages, you see exactly what failed and where.
Every error includes the edge server, region, error code, request metadata, and the specific failure context — which origin IP we couldn’t reach or which nameserver didn’t respond, and any other details that matter for that exact error. Exactly what you need to stop guessing and start fixing.
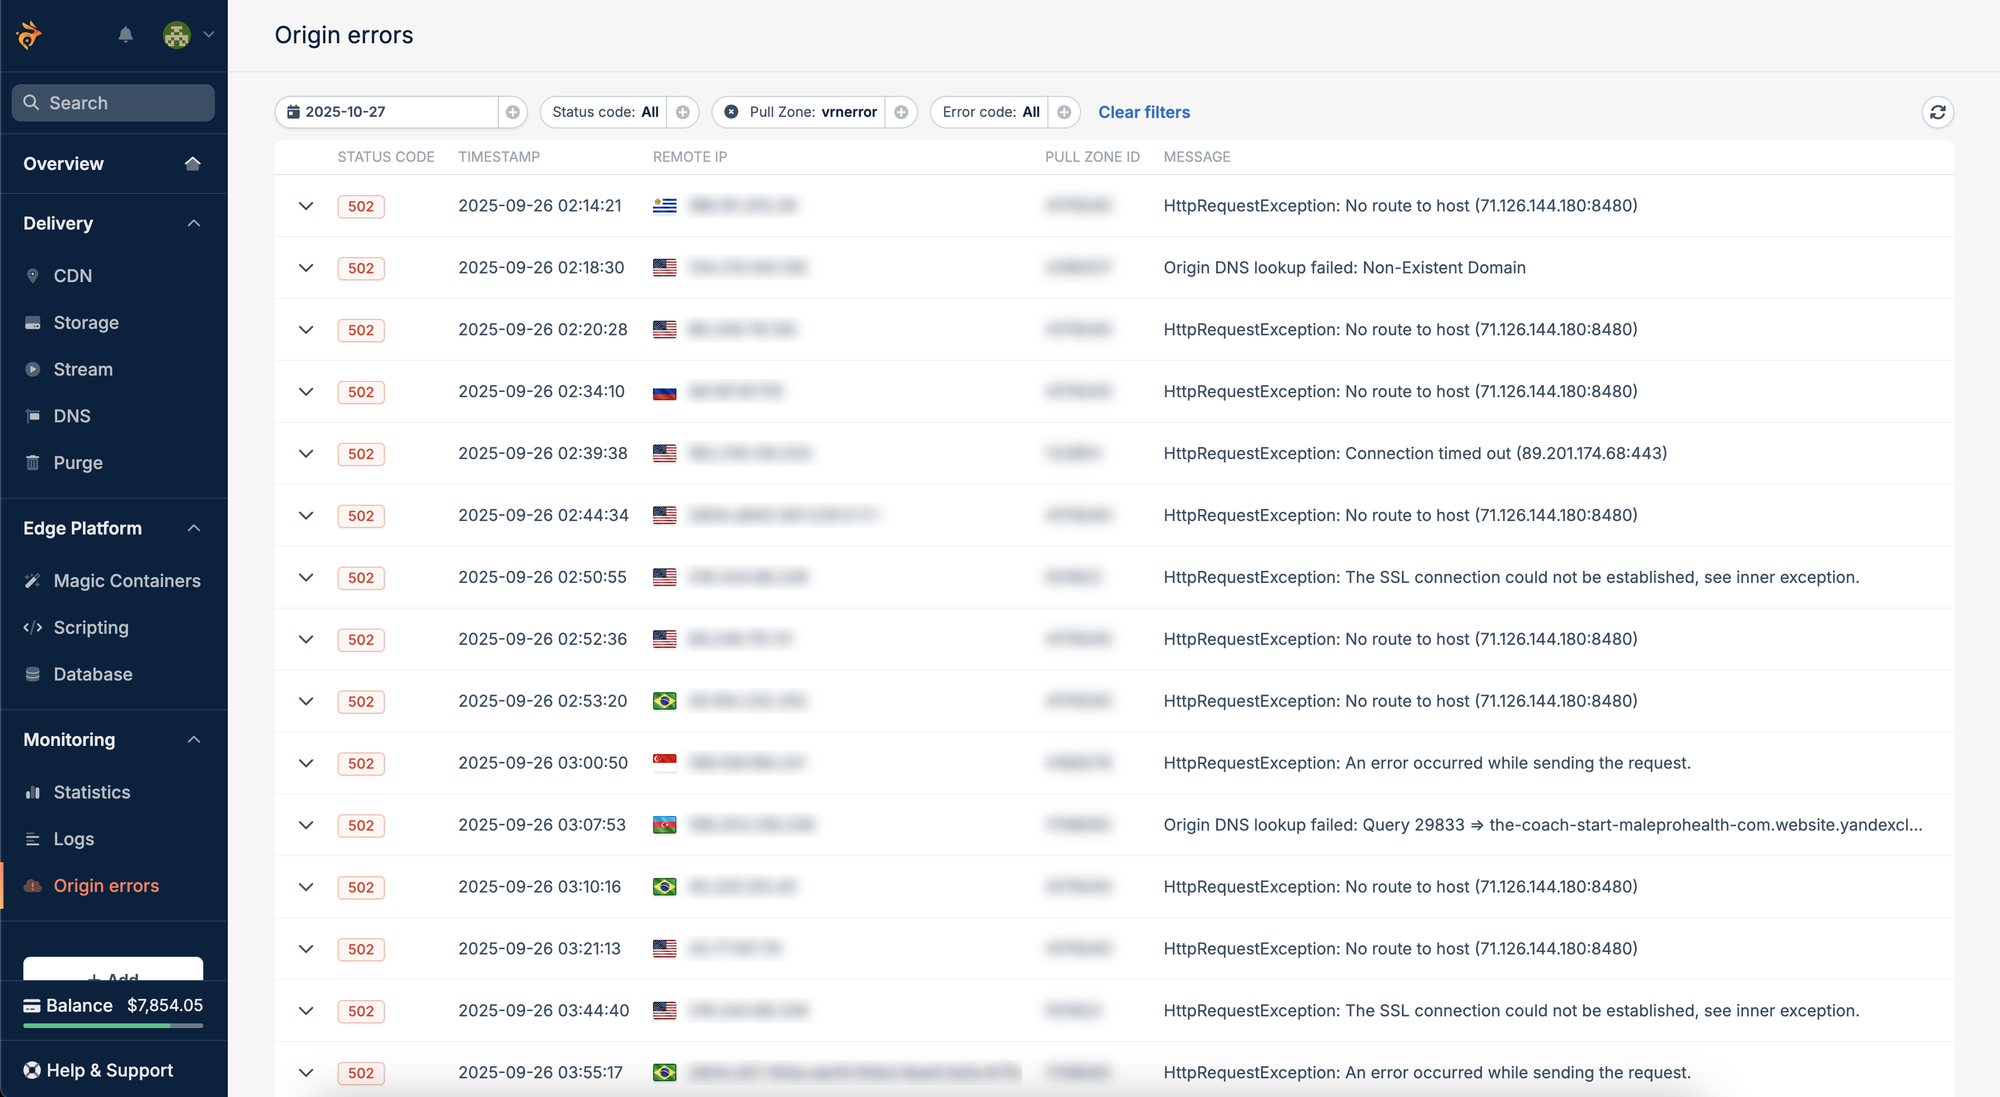
You can find it all in the new Origin Errors tab under Monitoring in your dashboard:
This lets you browse, filter, and pinpoint the exact cause of connection or availability issues as they occur. The errors covered include both origin-side failures, like DNS lookup errors, timeouts, or failed origin requests, and, on rare occasions, internal errors such as loop detections or missing local database entries. For a complete list of error types and what they mean, our documentation has you covered.
Pull the data where you need it
The dashboard is perfect for quick debugging. But when you need logs in your own systems, Grafana, or your incident workflow, the same data is available via the API.
Query by pull zone and date to get detailed JSON for every failure. Timestamp, error codes, headers, origin details, everything you need.
Here's what the response looks like:
For more details on programmatic access, head over to the origin errors API reference.
How this level of detail is even possible
Most CDN providers give you generic error messages: 502 errors, timeouts, vague “origin unreachable” notices. They can’t tell you why the connection failed, which component broke down, or which nameserver stopped responding. The details that actually help you debug stay hidden in the networking stack.
Most developer platforms rely on off-the-shelf proxy software or third-party components. Existing tools abstract away the low-level details. When a connection fails, they report “error” and move on. The context is lost somewhere in the networking stack.
We took a different approach.
bunny.net runs on custom-built proxy software that operates at the socket level. We’re no longer just forwarding requests. We’re handling every step of the connection ourselves. We figure out which IP and port to connect to, which socket flags to send, when to retry, and when to give up. We monitor socket properties in real time. When something fails, we know exactly why.
That’s how we can tell you which DNS nameserver isn’t responding, whether the failure happened during the TCP handshake or after it, whether your origin timed out after 5 seconds or 30 seconds, and whether it’s a transient network blip or a persistent misconfiguration.
When something does break, our proxy captures it immediately, enriched with timestamp, region, edge server, error code, and full request metadata. Then it streams into ClickHouse, our real-time analytics engine, where it’s indexed and ready for you to fetch in seconds.
Logs with bunny.net don’t just say “502 Bad Gateway”; they tell you:
dns_lookup_failed: nameserver 8.8.8.8 isn’t responding to queries for yourdomain.comhttp_timeout: origin took 31 seconds to respond, exceeding the 30-second timeouthttp_loop_detected: request bounced between pull zones due to a forwarding misconfiguration
This is the kind of granularity that turns “everything’s broken, I have no idea why” into “DNS is failing, I need to check our nameserver config.”
We retain origin error logs for 3 days, for free, and for everyone. Need longer retention? Pull logs via the API and store therm however you like.
Everyone deserves to see what’s breaking
You’d think a feature as basic as this should be fairly standard in the CDN world. Turns out, it's actually far from trivial to implement this and provide a useful level of detail. If there's any sort of visibility into origin errors, vendors usually deem it a nice-to-have, and another thing to lock behind a plan tier or paid add-on.
And when you’re stuck debugging at 3 a.m.? Even reaching out to support often hits a dead end. They can’t tell you what broke either because the platform never captured that level of detail in the first place. So you’re left going back and forth with support while your site stays down.
That’s not how we hop. Building this wasn’t simple: it meant custom development at the networking layer to capture failures at the edge, instrument every connection at the socket level, and process errors in real time without adding latency. But we wouldn’t have it any other way. We believe everyone deserves observability as a baseline, so we launched this feature at no extra cost.
Ready to hop into better debugging?
Origin errors are now live for all bunny.net users. Hopefully you won’t need it often, but when you do, when production is down and every second counts, it’ll be there, showing you exactly what’s broken and where to fix it.
This is one more step toward our vision: a faster, more transparent internet where builders of all sizes have the tools they need to succeed.